
Mastering the Market: How MACD RSI Shape Forex Trading in Indonesia
MACD RSI for Forex Indonesia: In Indonesia’s growing trading community, technical indicators have become more than just supplementary tools — they’re vital instruments in navigating an increasingly complex forex environment. With a market influenced by global interest rates, regional geopolitical developments, and domestic policy shifts from Bank Indonesia, Indonesian traders face a unique blend of volatility and unpredictability. Having a reliable system to interpret price data is essential, and this is where indicators like MACD and RSI come into play. These tools offer a structured way to read the market’s rhythm, helping traders identify not just trends but also the potential turning points in price behavior. In such a dynamic trading atmosphere, indicators serve as the trader’s second set of eyes — guiding decision-making with data rather than guesswork.
How Does MACD Work in the Context of the Indonesian Market?
The Moving Average Convergence Divergence (MACD) is widely recognized for its ability to reveal trend shifts and momentum in a chart. It operates by calculating the difference between two exponential moving averages (typically 12-day and 26-day EMAs) and then applying a 9-day signal line to interpret changes. In Indonesia, where news cycles and external pressures such as shifts in commodity prices or U.S. interest rates can trigger swift reactions in the IDR, MACD acts as a buffer against emotional trading. When a bullish crossover occurs — that is, when the MACD line rises above the signal line — traders often view it as a green light to enter long positions, especially if supported by other signals. Conversely, a bearish crossover may warn traders to prepare for a downturn. Indonesian traders often observe MACD alongside rupiah movements during major events like BI rate announcements or global oil price surges, using it as confirmation of broader macro trends.
Is RSI Still Reliable for Forex Traders in Indonesia?
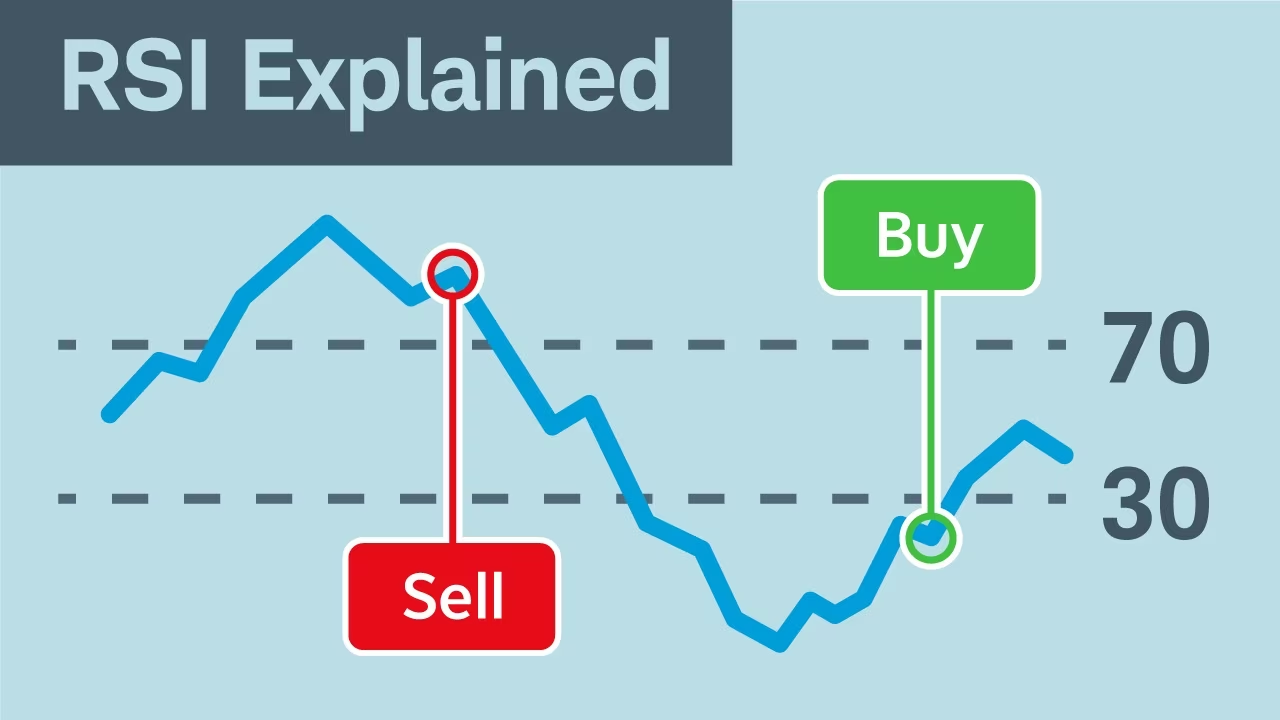
Source: schwab
The Relative Strength Index (RSI) remains one of the most trusted momentum indicators among both beginner and experienced traders in Indonesia. By measuring the speed and magnitude of recent price changes, RSI helps traders assess whether a currency pair is overbought (typically when RSI exceeds 70) or oversold (usually when it drops below 30). What makes RSI particularly valuable in the Indonesian context is its ability to neutralize emotional biases during turbulent market periods — for instance, when the rupiah is swinging due to external debt concerns or global inflation data. Indonesian forex traders often monitor RSI closely around key economic events, such as GDP reports or export-import updates, because a sudden spike in price can give a misleading impression of sustained momentum. RSI provides a more grounded view, suggesting whether the movement is sustainable or just a short-lived surge. When RSI and MACD are used in tandem, they offer a more well-rounded perspective on market behavior — one driven by momentum and another by trend confirmation.
MACD RSI for Forex Indonesia: Why Do Many Traders Combine MACD and RSI?

Source: UPSCALE Living
Individually, both MACD and RSI offer powerful insights. But when combined, they form a cohesive strategy that blends momentum analysis with trend-following logic. For Indonesian forex traders, who often operate in an environment shaped by regional news and currency volatility, the pairing of MACD and RSI allows for more precise timing. For example, when the MACD line crosses above the signal line and the RSI is approaching 60 (but not yet overbought), it often signals the beginning of a sustainable upward move — a cue that some traders might interpret as an early entry point. On the flip side, if MACD indicates a bearish divergence while RSI begins to fall below the midline, it might suggest weakening buying pressure. In this way, using MACD RSI for forex Indonesia has become something of a standard practice, especially for those looking to reduce risk while capitalizing on technical confirmation. The combination also helps filter out false signals, which are common during periods of thin liquidity, such as off-peak trading hours in Asia.
MACD RSI for Forex Indonesia: Are Bollinger Bands Useful for the Indonesian Trading Style?
Bollinger Bands — consisting of a simple moving average and two bands plotted two standard deviations away — offer traders a visual sense of volatility and potential price reversal zones. For Indonesian traders, especially those dealing with the often reactive USD/IDR or EUR/IDR pairs, Bollinger Bands help assess whether a market move is likely to continue or pull back. When price touches the upper band and begins to stall, it can suggest an overbought condition, particularly when confirmed by a high RSI reading. Likewise, a price dip below the lower band may be a sign of overselling. What’s interesting about using Bollinger Bands in Indonesia is their effectiveness during regional news events, like Bank Indonesia’s inflation outlook or ASEAN trade agreements, which can cause sharp but temporary price movements. Indonesian traders often wait for “band squeezes” — periods where the bands contract, indicating low volatility — as precursors to major breakouts. When used with MACD RSI signals, Bollinger Bands offer a stronger context for interpreting price action and potential trade setups.
MACD RSI for Forex Indonesia: How Are Moving Averages Applied in the Indonesian Forex Scene?
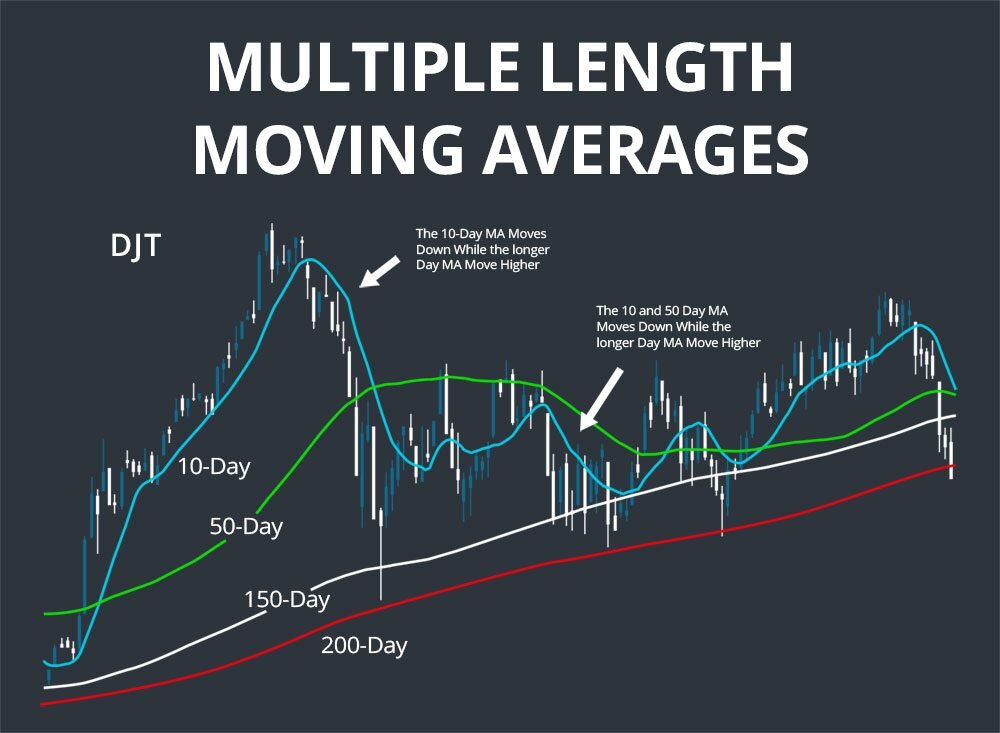
Source: SCANZ
Moving averages are among the most frequently used indicators in Indonesia’s trading circles due to their simplicity and ability to reveal trend direction over time. Whether using simple (SMA) or exponential (EMA) variants, traders rely on these averages to smooth out erratic price behavior and uncover broader market sentiment. In particular, crossovers between shorter and longer MAs — such as the 20-day crossing above the 50-day — are viewed as important signals of trend shifts. For Indonesian traders, these moments can coincide with policy changes, central bank interventions, or even shifts in foreign investment flows. Many use EMAs because they give more weight to recent prices, which is crucial when markets are moving in response to real-time headlines. For example, when the IDR weakens in reaction to a surprise Fed hike, watching how the moving average reacts can help determine whether the move has momentum or is merely speculative. Combined with MACD RSI for forex Indonesia, moving averages create a robust technical framework that supports disciplined trade execution.
Can Stochastic Indicators Improve Trade Timing in Indonesia?
The stochastic oscillator is another momentum tool that is especially useful for identifying overbought and oversold conditions in a market. Unlike RSI, which compares current price to recent highs and lows, stochastic indicators measure the closing price in relation to the price range over a specific period. This subtle difference can be meaningful for Indonesian traders who favor shorter time frames, such as intraday or swing trading. The fast-paced nature of forex in Southeast Asia, especially during overlapping sessions with the European market, makes timing crucial. The stochastic indicator helps traders identify when a price move may be losing steam or is primed for reversal. A crossover in the stochastic lines in the overbought zone, for example, may provide a signal to prepare for a sell — particularly when backed by a MACD divergence or RSI peak. This layered approach enhances timing and helps avoid entering positions too early, which is a common mistake among new traders in Indonesia’s energetic forex landscape.
What Are Common Mistakes to Avoid with Technical Indicators?
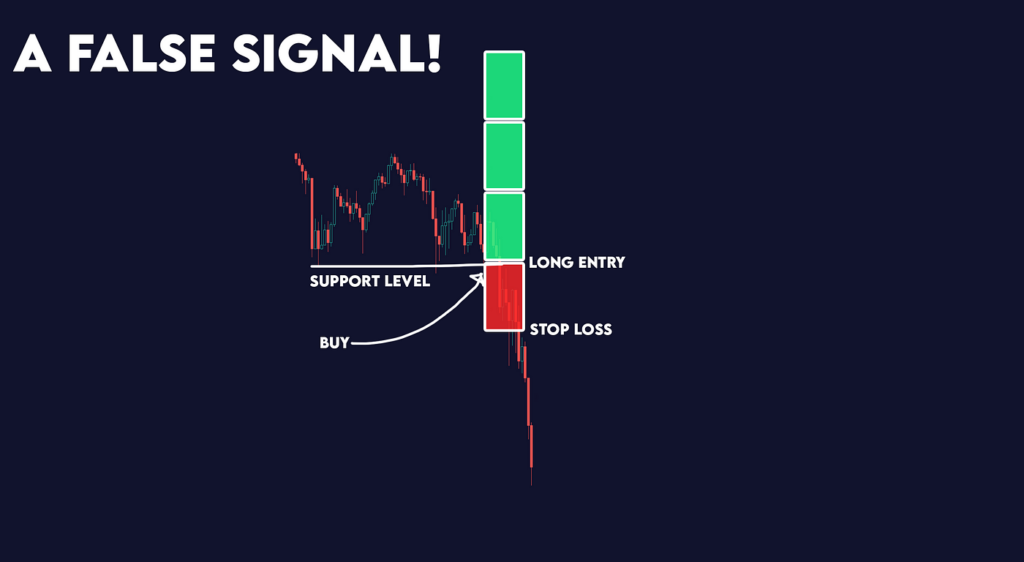
Source: Medium
A key issue faced by many traders — especially newer ones — is treating indicators like MACD or RSI as standalone decision-makers. While these tools are designed to simplify market analysis, they are not infallible and can produce false signals, particularly in choppy or news-driven markets. In Indonesia, where forex prices can shift rapidly in response to sudden political announcements, economic indicators, or external market forces, relying purely on one technical signal can lead to poorly timed trades. Another common error is ignoring the broader macroeconomic context. No indicator can tell you why the rupiah is moving; it only shows how. Failing to incorporate fundamental news, such as Bank Indonesia’s policy statements or global commodity fluctuations, can lead to misinterpreting signals. Lastly, forcing setups to match what you want to see — rather than reading what’s actually on the chart — often results in losses. Effective trading involves using technical indicators like MACD and RSI in concert with market awareness and disciplined risk management.
Final Thoughts: Are MACD and RSI Still the Best Choices in 2025?
Looking into the second half of 2025, it’s clear that MACD RSI for forex Indonesia remains a foundational part of the technical toolkit for traders across the country. These indicators are popular not because they’re trendy, but because they consistently deliver clarity in uncertain conditions. Their adaptability to different timeframes and responsiveness to market momentum make them suitable for a wide range of trading styles — from long-term investors to daily scalpers. In the context of Indonesia’s active and evolving forex landscape, where price behavior can be erratic yet pattern-driven, MACD and RSI offer both structure and insight. When complemented by supporting tools like Bollinger Bands, stochastic oscillators, or moving averages, they help traders build systems that are not only technically sound but also attuned to the local market’s pulse.