
Exploring TradingView Tools: A Beginner’s Journey into Forex and Stock Charting
TradingView Tools: A Beginner’s Journey into Forex and Stock Charting
Whether you’re casually observing markets or planning your first forex trade, understanding TradingView tools is often the first real step into technical analysis. While advanced traders may use complex strategies and custom scripts, most newcomers begin with a simple question: where do I start?
This guide is for beginners who want to explore TradingView without feeling overwhelmed. We’ll walk through its essential functions, explore how it feels to use the platform, and learn how to use its free charting features. We’ll also touch on how Vietnamese traders can make the most of these tools.
What is TradingView tools?
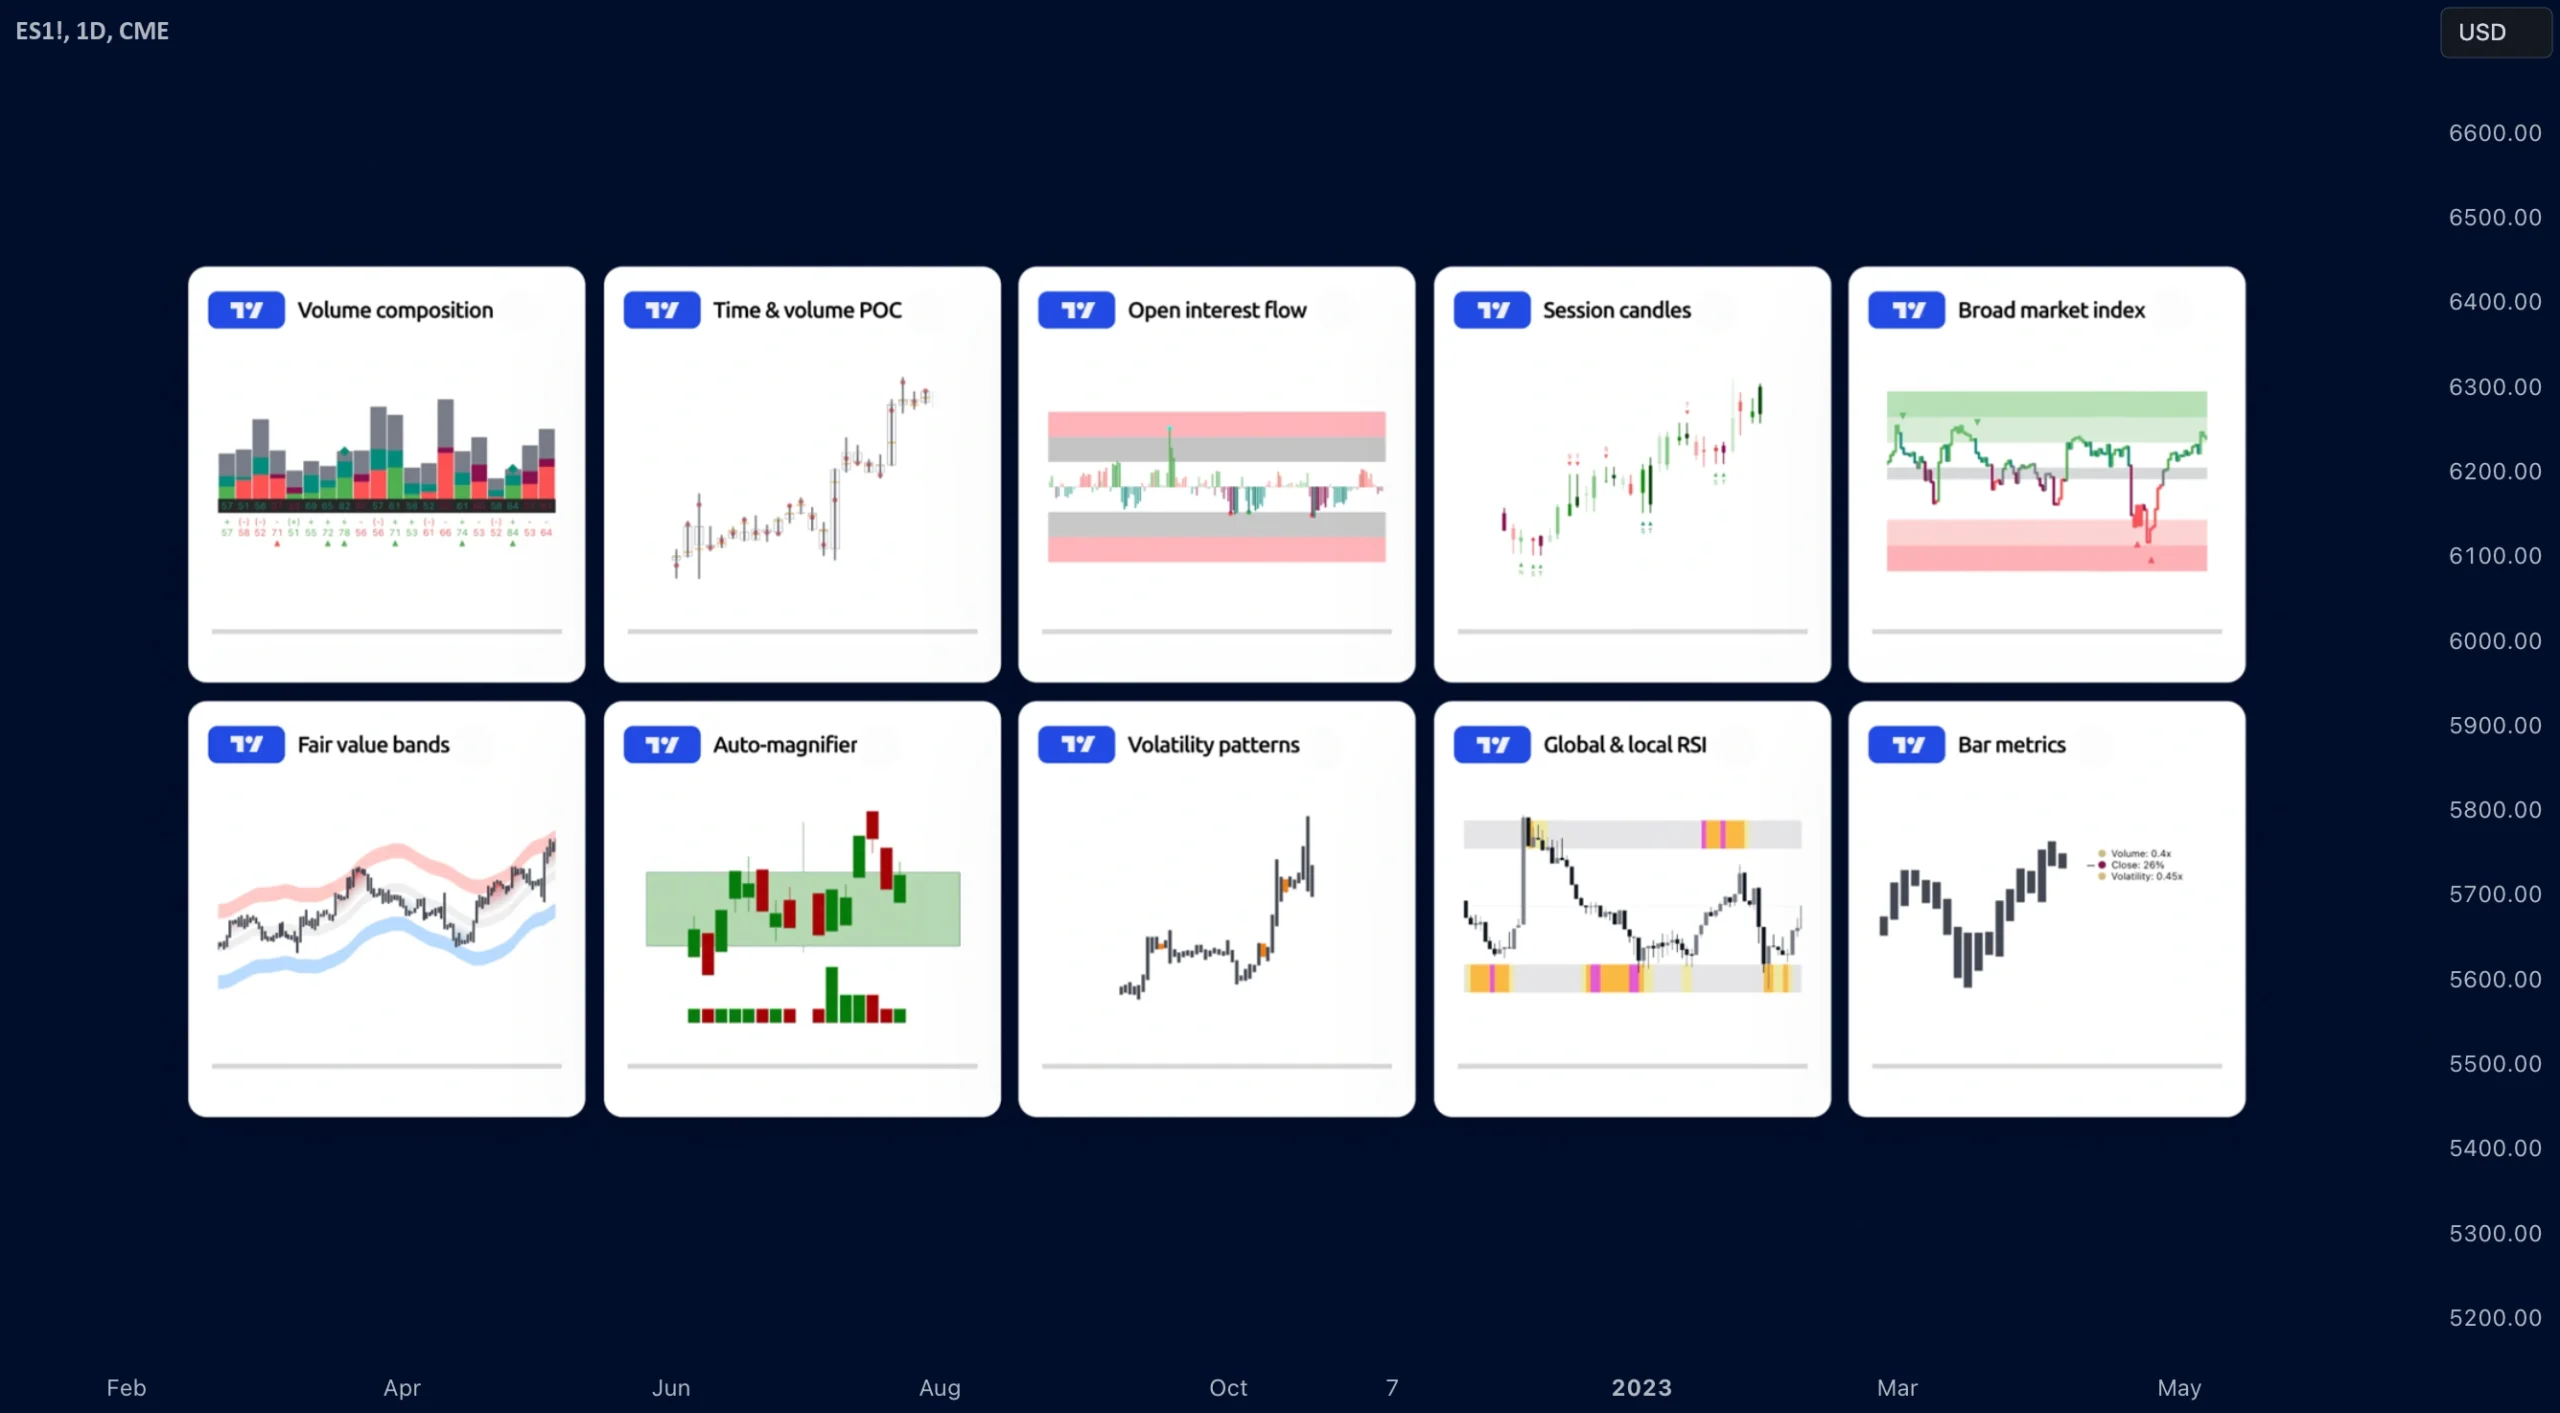
Credit from TradingView
TradingView is a browser-based platform that offers real-time charts and technical analysis tools for a variety of financial markets. Whether you’re looking at forex, stocks, crypto, indices, or even economic indicators, you can analyze it all in one place.
Despite its polished interface, TradingView is surprisingly intuitive. At its heart lies the price chart—a dynamic window into market behavior. Around this chart, however, is a versatile set of tools that help you draw conclusions, track patterns, and stay informed.
Getting to Know the Interface
Opening TradingView for the first time can feel like stepping into a cockpit. There’s a lot on screen, but you don’t need to use it all at once.
The chart dominates the screen, while a toolbar on the left gives you drawing tools—lines, arrows, Fibonacci retracements, and more. Across the top, you’ll find controls to search for instruments, change timeframes, switch chart types, and add indicators. On the right side, features like watchlists, alerts, and chat functions live. Below the chart, you can access backtesting tools and the Pine Script editor.
If you’re just starting out, the best approach is to pick one or two features and slowly build familiarity. The platform remembers your settings and layouts, so your workspace can evolve with your learning.
Searching for Symbols and Navigating Charts
At the top of the platform is a search bar where you can type in any trading symbol. For example, type “USD/VND” to bring up the Vietnamese dong exchange rate, or search for “VNINDEX” to view the Vietnamese stock market index.
Once your chart loads, you can change time intervals (ranging from 1-second to monthly charts), scroll through price history, or adjust your view with zooming and dragging tools.
Most traders prefer candlestick charts for forex and stock analysis because they offer clear information about price movement and sentiment.
Using Drawing Tools for Analysis
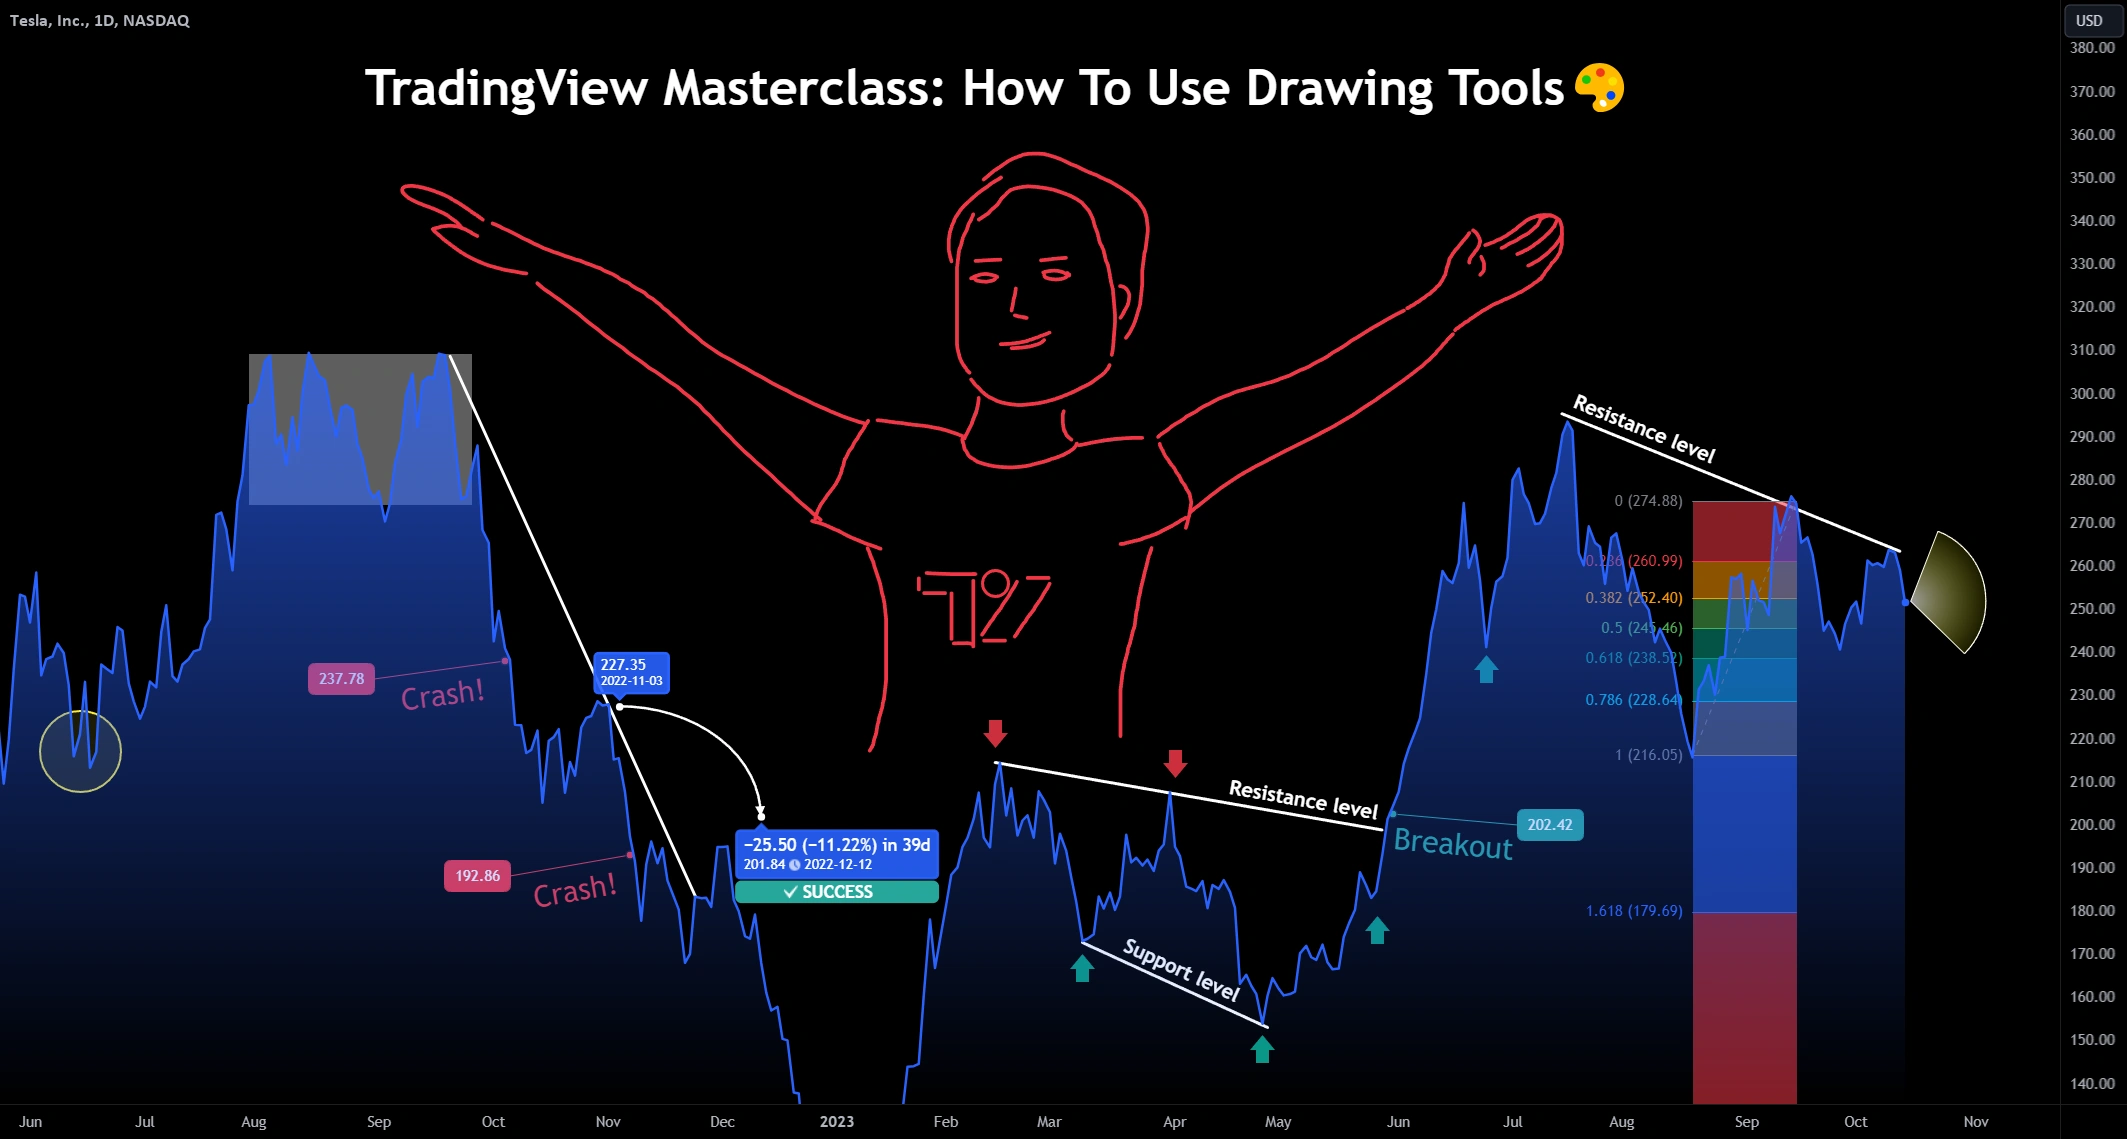
Credit from TradingView
As a beginner, drawing tools can help make sense of price action. You can sketch trendlines to identify market direction, draw horizontal levels to mark support and resistance, or use the Fibonacci retracement tool to estimate potential pullback zones.
For example, if you’re following a VN30 stock, you might draw a line at a price level where the stock has repeatedly bounced in the past. Adding notes and shapes can also help annotate your thoughts or hypotheses right on the chart.
These simple visuals can often give clarity when markets look chaotic.
Indicators: The Analytical Layer
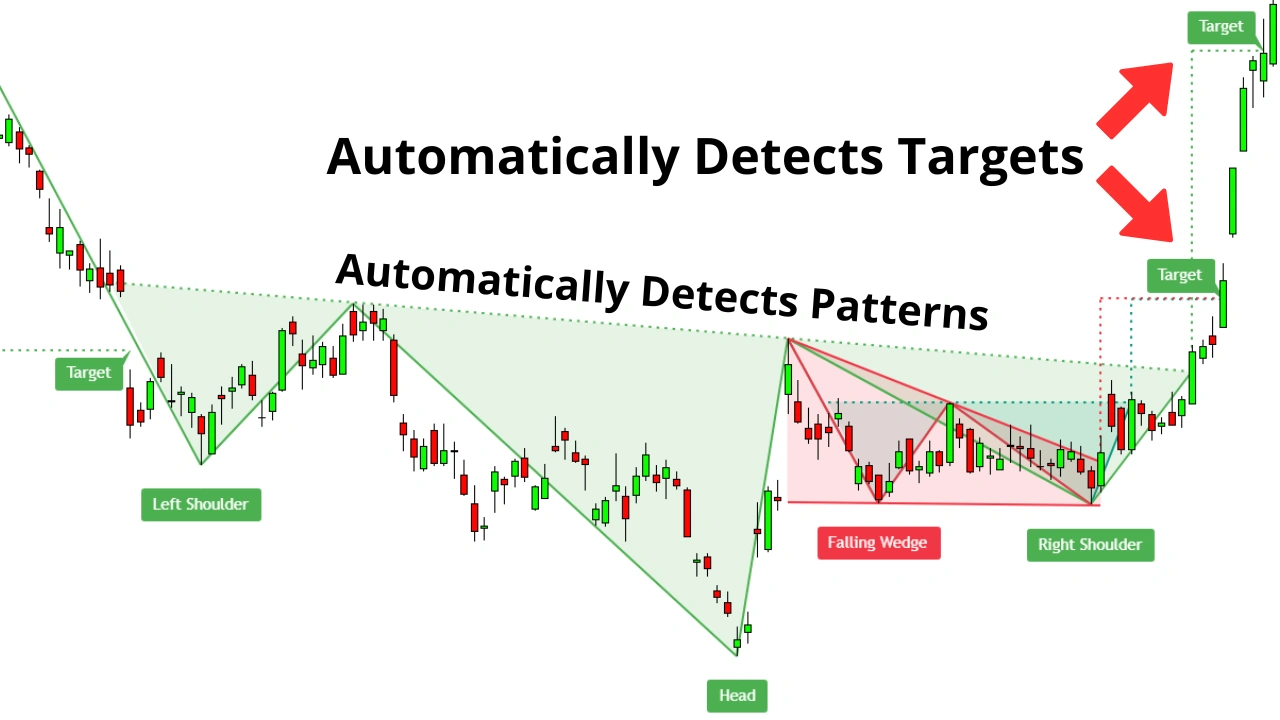
Credit from Mind Math Money
Indicators add another dimension to your chart. Clicking the “Indicators” button opens a menu with categories like built-in tools (RSI, MACD, moving averages), financial metrics for stock traders, and user-generated community scripts.
Many Vietnamese traders combine Moving Averages with RSI to interpret momentum and potential turning points on the VN-Index. If you’re unsure where to start, check out the Editor’s Picks or top-rated scripts in the community section.
You can also right-click on any indicator to customize its settings, colors, and appearance to suit your preferences.
Saving Layouts and Organizing Your Workspace
TradingView allows you to save chart layouts, making it easier to switch between markets and strategies. For example, if you follow both the forex market and the Vietnamese stock exchange, you might create a “Forex” layout for USD pairs and a separate “VN Market” layout featuring VNINDEX and major local stocks.
Each layout remembers your indicators, drawing tools, and customizations, allowing you to build routines that suit your trading habits.
TradingView tool’s Role in the Vietnamese Trading Scene
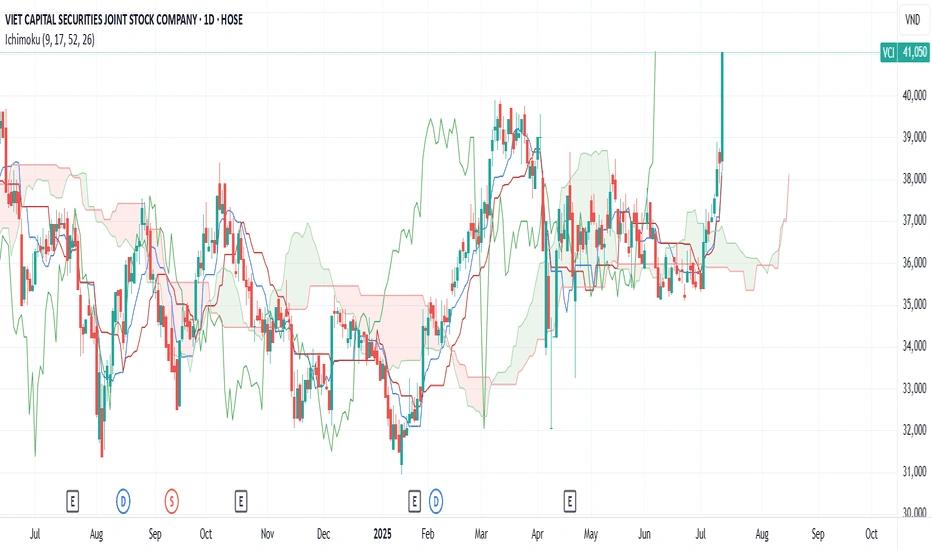
Credit from TradingView
Although TradingView is an international platform, its relevance in Vietnam is growing. Retail investors are using it to monitor VN-Index charts, explore forex movements involving the dong (VND), and prepare for daily market sessions.
Social groups on Facebook and Zalo often share insights, TradingView screenshots, and custom indicators tailored for Vietnamese traders. This local knowledge layer helps beginners get up to speed more quickly.
TradingView tools Conclusion: A Friendly Starting Point for Market Exploration
TradingView tools for forex charting—and beyond—offer a well-balanced mix of accessibility and depth. Beginners don’t need to understand every function at once. Instead, they can focus on chart navigation, try basic drawing tools, experiment with one or two indicators, and follow how the VN-Index or USD/VND pairs behave over time.
As your skills grow, the platform has the depth to support you. But for now, let curiosity lead the way. Explore, test, and slowly build confidence as you continue your journey into technical charting.